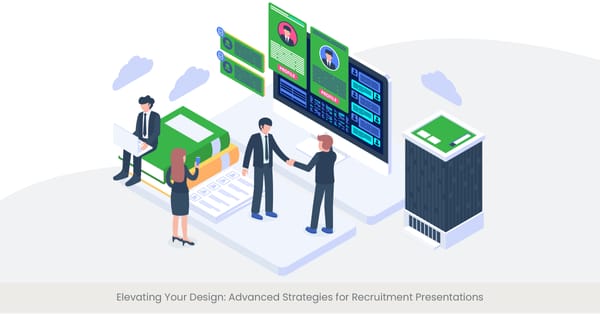
The Importance of Data in Recruitment Strategy

Introduction to Data-Driven Recruitment
In the competitive landscape of talent acquisition, the strategic use of data stands out as a crucial element in shaping successful recruitment campaigns. By leveraging data, companies can enhance their recruitment sourcing strategies, making them not only more efficient but also more effective. Data-driven decision-making allows hiring managers and recruiters to identify patterns, predict hiring needs, and improve the overall quality of hires. This section will explore how integrating data into recruitment strategies can transform talent sourcing from a hit-or-miss approach to a targeted, scientific pursuit.
The Evolution and Relevance of Data in Recruitment
Historically, recruitment was often a reactive process, based on immediate needs without a strategic long-term view. However, as the business world has evolved, so has the approach to recruitment. The adoption of analytics and data science in recruitment has marked a significant shift from intuition-based decisions to data-driven strategies. The foundation of a robust recruitment strategy now lies in understanding and utilizing data effectively. This includes tracking metrics like time to hire, cost per hire, and the effectiveness of sourcing channels to source candidates, which provide invaluable insights that drive strategic decisions.
Real-World Applications and Current Trends
Illustrating the impact of data in recruitment, many leading companies have adopted sophisticated data visualization tools to streamline their recruitment process. For instance, tech giants and startups alike use dashboards that provide real-time insights into their recruitment funnel— from the number of applicants and interviews conducted to the stages where candidates drop out. These visual tools help pinpoint bottlenecks and inefficiencies in the hiring process, allowing companies to adjust their strategies in real-time. Moreover, industries across the board, from healthcare to finance, utilize demographic data visualization to enhance diversity and inclusion efforts within their recruitment strategies.
Validating the Importance of Data with Research and Statistics
Research and statistics play a pivotal role in validating the importance of data in recruitment strategies. For example, a study by LinkedIn shows that companies who use data-driven recruitment strategies can improve their quality of hire by up to 70%. Furthermore, the Aberdeen Group found that organizations using data effectively see a 50% decrease in turnover rates, as data helps them match candidates more accurately to the role and company culture. These insights not only support the critical role of data in recruitment but also highlight the tangible benefits of its application.
Recruitment Process Presentations
Effective recruitment process presentations help organizations streamline hiring by showcasing critical aspects such as candidate evaluation, interview stages, and job role expectations. By using these presentations, hiring teams can maintain clear communication and efficiency throughout the recruitment journey, ensuring consistency and alignment across different teams.
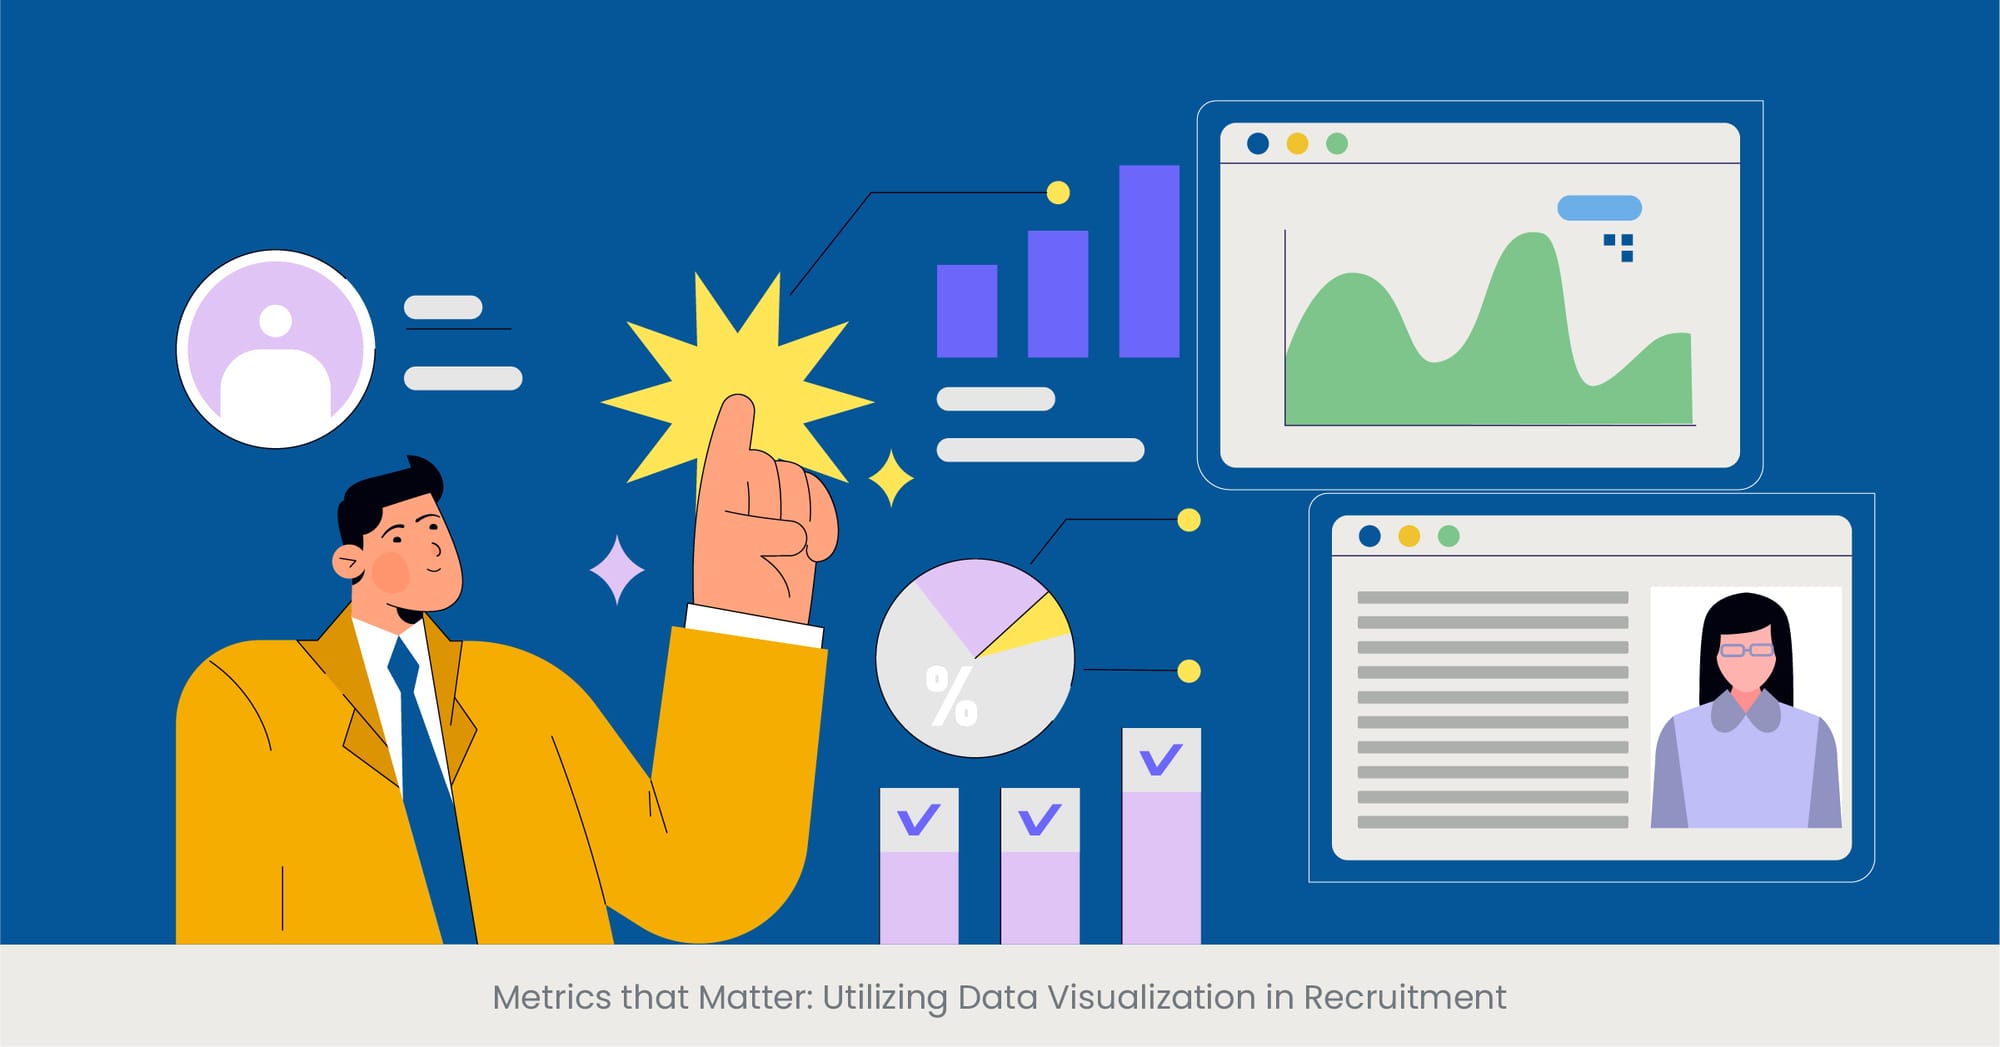
Choosing the Right Metrics for Visualization

Identifying Key Recruitment Metrics
Choosing the right metrics to visualize is critical in maximizing the effectiveness of a recruitment sourcing strategy. The selection of metrics should align with the specific goals and challenges of the recruitment process within an organization. Key metrics often include the time to fill positions, cost per hire, source of hire, and candidate satisfaction rates. By focusing on these metrics, recruiters and hiring managers can gain actionable insights that directly impact the efficiency and effectiveness of their hiring strategies.
Historical and Strategic Context of Recruitment Metrics
To understand the value of these metrics, it's important to consider their historical and strategic context. Traditionally, recruitment metrics were limited to basic data like the number of hires or the cost of postings. However, as the recruitment landscape has evolved, so has the complexity and specificity of the metrics tracked. Strategic metrics now focus not only on operational efficiency but also on long-term outcomes such as employee retention and performance. This evolution reflects a broader shift in talent acquisition, from a transactional task to a strategic component of business success.
Workforce Development Presentations
Workforce development presentations play a crucial role in upskilling and reskilling employees. By utilizing these presentations, organizations can clearly communicate career progression opportunities, training programs, and development initiatives, ultimately fostering a culture of continuous learning and employee retention within the company.
Case Studies and Examples of Effective Metric Utilization
Highlighting the practical application of choosing the right metrics, consider the case of a global retail company that revamped its recruitment strategy by implementing a new analytics dashboard. By visualizing metrics such as time to fill and applicant quality across different regions, they were able to identify specific bottlenecks and improve their recruitment process significantly. Another example is a tech startup that focused on visualizing source efficiency metrics to determine which recruiting channels yielded the highest quality candidates. As a result, they optimized their spending and focused efforts on the most effective candidate sourcing channels, thereby improving their ROI on recruitment.
Research and Statistics Supporting Metric Choices
The importance of selecting the right metrics is underscored by numerous studies and industry reports. According to research by Bersin by Deloitte, organizations that are sophisticated in their use of recruitment metrics are twice as likely to find top talent, three times as likely to reduce costs, and twice as likely to improve their recruiting efficiency. Additionally, a survey by the Society for Human Resource Management (SHRM) indicated that companies that actively measure return on investment (ROI) for their sourcing strategies are 34% more likely to demonstrate higher efficiency in their recruitment efforts.
See how leading companies have transformed their recruitment processes with data visualization. Download our case studies to learn how INK PPT has helped businesses optimize their recruitment strategies through visual insights and real-time metrics.
Tools and Software for Data Visualization in Recruitment
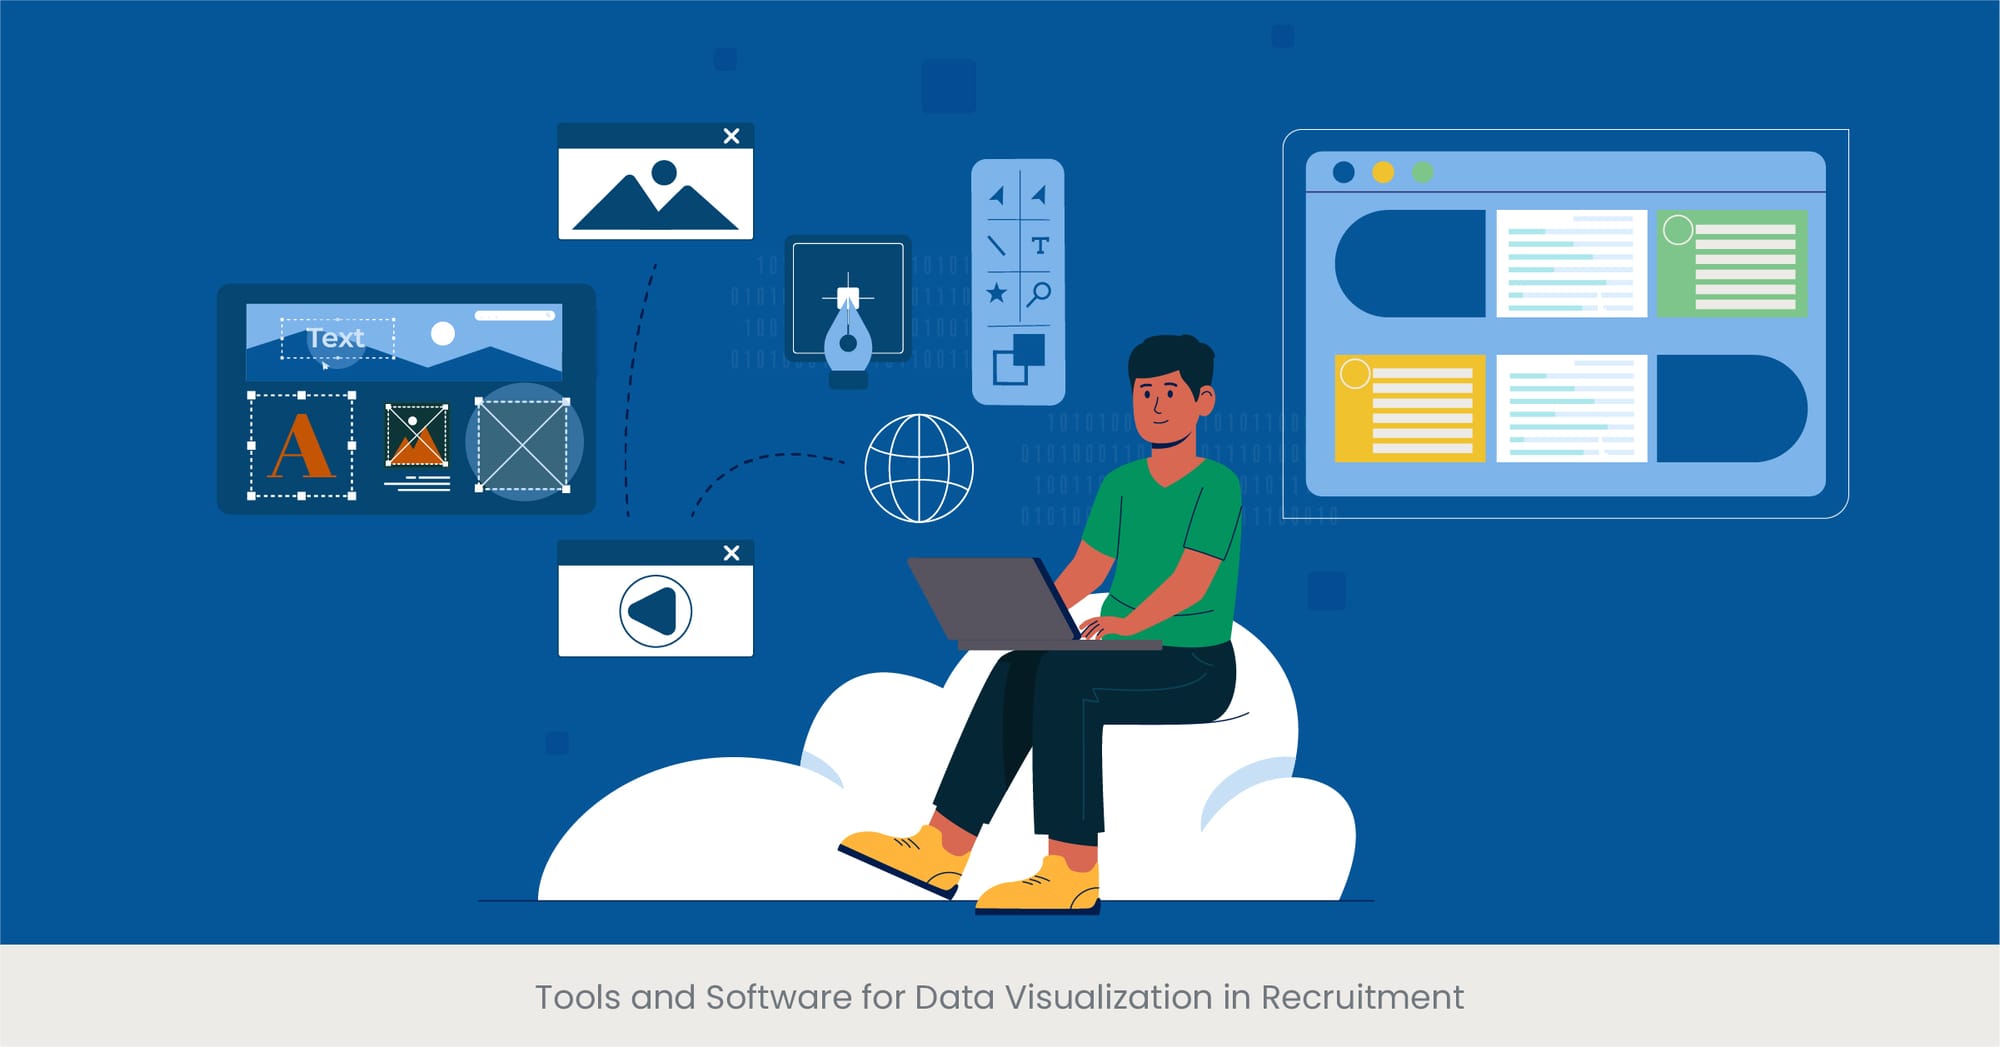
Overview of Essential Data Visualization Tools
In the digital age, the right tools and software are pivotal for effectively visualizing recruitment data. These tools not only simplify the analysis of complex datasets but also enhance the presentation and accessibility of key metrics. Popular tools in the market include Tableau, Microsoft Power BI, and Google Data Studio. Each tool offers unique features that cater to different needs, such as real-time updates, customizable dashboards, and integration capabilities with existing HR software systems, making them indispensable in a recruiter’s toolkit.
Background on the Evolution of Visualization Tools
The evolution of data visualization tools in recruitment mirrors broader technological advancements. Initially, organizations relied on simple spreadsheets and basic charts to track recruitment metrics. However, with the advent of more sophisticated software, companies can now create dynamic visualizations that provide deeper insights into the recruitment process. These advancements have enabled recruiters to predict trends, assess the effectiveness of different sourcing channels, and make data-driven decisions swiftly and with greater confidence.
Case Studies Demonstrating Tool Effectiveness
Real-world examples vividly illustrate the effectiveness of these tools. For instance, a multinational corporation implemented Power BI to overhaul its recruitment data analysis. By using Power BI’s comprehensive visualization capabilities, the company was able to significantly reduce its time to hire by identifying inefficiencies in its process and reallocating resources more effectively. Another case involves a tech startup that used Tableau to track diversity metrics and improve their recruitment strategies towards building a more inclusive workforce. These case studies showcase how powerful visual tools can facilitate strategic recruitment planning and execution.
Research and Insights on Tool Selection and Impact
Selecting the right visualization tool can dramatically impact the success of recruitment efforts. Research by Gartner highlights that organizations leveraging advanced visualization tools report up to a 30% improvement in decision-making speed. Another study emphasizes the role of these tools in enhancing communication between recruiters and hiring managers, making the recruitment process more collaborative and transparent. These tools not only provide critical insights but also foster a data-centric culture within recruitment teams, aligning them towards common goals and strategies.
Ready to take your recruitment strategies to the next level? Explore how INK PPT’s cutting-edge data visualization services can help you design dynamic, insightful dashboards that streamline your hiring process. Contact us today to transform your recruitment strategies with custom visualizations!”
Designing Dashboards for Real-Time Insights

Importance of Dashboards in Recruitment
Dashboards are essential for synthesizing complex recruitment data into accessible and actionable insights. They provide a centralized, visual representation of data that helps recruitment teams monitor key performance indicators (KPIs) and metrics in real-time. Effective dashboards are designed to highlight areas that require immediate attention, allowing for swift responses to changes in the recruitment landscape, such as shifts in candidate availability or bottlenecks in the hiring process.
Principles of Effective Dashboard Design
The design of an effective recruitment dashboard follows certain principles to ensure usability and functionality. It should be intuitive, with a clear layout that prioritizes important metrics and minimizes clutter. Customization is key, as it allows different users—from recruiters to hiring managers—to personalize views according to their specific needs and objectives. Furthermore, a good dashboard should be interactive, enabling users to drill down into metrics for deeper analysis and to filter data to view specific information relevant to their tasks.
Examples of Dashboard Implementation
Practical examples highlight the impact of well-designed dashboards. A large technology firm developed a recruitment dashboard that tracks the stages of the hiring process for each candidate, providing insights into where candidates drop out or delays occur. This real-time data allowed the firm to streamline its process, significantly reducing the average time to hire. Another example is a healthcare provider that used a dashboard to track the effectiveness of different recruitment channels, enabling it to allocate resources more efficiently and reduce recruitment costs.
Supporting Research and Data on Dashboard Usage
The effectiveness of dashboards in recruitment is supported by various studies. According to a report by Deloitte, organizations that use sophisticated dashboards for real-time data tracking are 75% more likely to have a high maturity level in their HR functions. Another study found that dashboards help reduce the time spent by recruiters on data management by up to 30%, allowing them to focus more on strategic aspects of recruitment such as candidate engagement and employer branding.
Want more insights on leveraging data in your recruitment process? Check out our latest blogs for expert tips on maximizing your hiring efficiency through data-driven strategies.
Visualizing Demographic Data for Diversity Goals
Role of Demographic Data in Promoting Diversity
Demographic data visualization plays a crucial role in advancing diversity and inclusion within the workplace. By presenting clear and concise visual representations of demographic metrics, organizations can better understand the composition of their workforce and identify areas where diversity initiatives are needed. This proactive approach helps in targeting recruitment efforts to ensure a more inclusive environment, promoting a range of perspectives that enhance creativity and problem-solving within teams.
Understanding Demographic Data
Demographic data encompasses a variety of indicators, including age, gender, ethnicity, educational background, and disability status, among others. Visualizing this data allows organizations to assess their recruitment strategies and adjust them to better reflect the diverse world we live in. It also aids in compliance with equal employment opportunity laws and can enhance the organization's reputation by showing a commitment to diversity.
Case Studies on Effective Demographic Data Use
Several companies have successfully used demographic data visualization to meet their diversity goals. For instance, a leading financial services firm implemented a series of dashboards that track the diversity of their applicants and hires across different departments. This visualization tool helped them identify departments with low diversity and adjust their recruitment strategies accordingly. Another example is a tech company that used demographic data to enhance its university recruitment programs, focusing efforts on institutions with a high rate of diversity to build a more varied talent pool.
Research and Insights on the Impact of Demographic Data Visualization
The impact of visualizing demographic data on achieving diversity goals is well-documented. Research by McKinsey has shown that companies with more diverse workforces perform better financially. Additionally, a study by Catalyst found that visual data tools help companies monitor progress towards diversity targets more effectively, promoting transparency and accountability. These tools also facilitate discussions on diversity at all levels of the organization, from executive boards to individual teams, fostering a culture of inclusiveness.
Case Studies: Data-Driven Recruitment Successes
Exploring Successful Data-Driven Recruitment Strategies
The power of data-driven recruitment strategies can be best understood through real-world case studies that highlight their effectiveness in improving hiring processes. These examples showcase how organizations harness data to optimize their recruitment efforts, reduce costs, and enhance the quality of hires. By analyzing successful strategies, other companies can glean insights and apply similar principles to their own recruitment practices.
In-depth Look at Specific Case Studies
One notable case is a global e-commerce giant that implemented advanced predictive analytics to forecast hiring needs based on market trends and company growth data. This proactive approach allowed them to prepare and execute recruitment drives just in time, avoiding the pitfalls of understaffing or overhiring. Another example involves a multinational IT service company that used data visualization to streamline its recruitment process. By identifying the most efficient sourcing channels and improving candidate screening methods, the company was able to cut its average hiring time by 40% and increase candidate satisfaction.
Real-World Examples and Outcomes
Further illustrating the impact, a healthcare provider used data analytics to address high turnover rates among new hires. By analyzing exit interview data and job performance metrics, they identified key factors leading to early resignation and adjusted their recruitment criteria and onboarding process accordingly. This strategic change led to a 25% decrease in turnover within the first year. Additionally, a tech startup focused on enhancing its diversity through data-driven recruitment analyzed demographic data across all job postings and adjusted its advertising strategies to target a broader range of candidates, successfully increasing the diversity of its applicant pool by 30%.
Onboarding Presentation Design
A well-structured onboarding presentation design sets the stage for new employees' success. By crafting visually engaging and informative presentations, companies can efficiently introduce their culture, values, and processes. This ensures a smooth transition for new hires, helping them quickly acclimate and contribute to the organization’s goals.
Supporting Data and Research on Recruitment Successes
Studies and research further validate the benefits of data-driven recruitment. According to a report by the Boston Consulting Group, companies that integrate data into their hiring decisions see up to a 50% cut in costs, a 70% decrease in turnover, and a significant increase in employee performance. These statistics not only underscore the efficacy of data-driven approaches but also highlight how critical it is for companies to adopt these practices in order to remain competitive in today’s job market.
Avoiding Common Pitfalls in Data Presentation
Recognizing Common Errors in Data Visualization
In the realm of recruitment, effective data presentation is crucial for making informed decisions. However, there are several common pitfalls that can hinder the utility of data visualizations. These include overcrowding visuals with too much information, using inappropriate or confusing chart types, and failing to maintain data integrity through inconsistent data sources or outdated information. Recognizing and avoiding these errors can greatly enhance the clarity and effectiveness of data-driven recruitment strategies.
Key Principles for Effective Data Presentation
To avoid these common pitfalls, it’s important to adhere to key principles of effective data presentation. This includes simplicity, accuracy, and relevance. Visualizations should be straightforward and focused, designed to communicate the most important insights quickly and clearly. Accuracy is paramount, as misleading data can lead to poor recruitment decisions. Finally, ensuring that the data presented is relevant to the stakeholders involved helps maintain engagement and facilitates better decision-making.
Examples of Best Practices in Data Presentation
Effective data visualization practices can be demonstrated through successful case studies. For example, a leading tech company redesigned its recruitment dashboard by prioritizing clarity and simplicity, which resulted in a significant increase in user engagement and satisfaction among hiring managers. They achieved this by using a consistent color scheme, simplifying graph formats, and providing clear legends and explanations. Another example involves an organization that avoided the common pitfall of using complex and dynamic graphs for an audience not well-versed in data analytics by adopting more straightforward, static visualizations which improved comprehension and actionable decision-making.
Tailoring Presentations for Hiring Needs
Tailoring presentations to the specific hiring needs of different roles ensures that the recruitment process is optimized. Whether it's for recruitment process presentations or onboarding design, customizing the content helps engage the audience and addresses the unique demands of various departments, ensuring a cohesive hiring experience.
Supporting Evidence from Industry Research
Research underscores the importance of avoiding these pitfalls. A study by the Society for Human Resource Management (SHRM) found that recruitment teams that optimize their data presentations for clarity and accessibility are 35% more likely to report satisfaction with their recruitment efforts and outcomes. Additionally, guidelines from data visualization experts like Edward Tufte emphasize the importance of displaying data with integrity, noting that the best visualizations are those that present clear, accurate, and meaningful data without distortion.
Customizing Visualizations for Different Audiences
Understanding Audience-Specific Needs
The effectiveness of data visualization in recruitment significantly depends on its ability to cater to the specific needs and understandings of different audiences. Recruiters, hiring managers, and company executives often look for different types of information and may have varying levels of data literacy. Tailoring visualizations to meet these diverse needs can enhance comprehension and facilitate more informed decision-making across all levels of an organization.
Principles of Effective Visualization Customization
Customizing visualizations involves more than just altering aesthetics; it requires a deep understanding of the audience’s data interpretation skills and their decision-making needs. For example, recruiters might need detailed operational data to manage day-to-day activities, whereas executives may prefer high-level summaries that focus on strategic implications and outcomes. Effective customization also involves considering the format and delivery method of the visualization, ensuring it is accessible and actionable for the intended users.
Case Studies on Successful Customization
Illustrating successful customization, a multinational corporation developed a series of recruitment dashboards tailored to different departmental needs. The HR department received a detailed dashboard focused on diversity and turnover metrics and employee referrals, while the finance department accessed a streamlined version emphasizing cost-per-hire and budget forecasts. This approach ensured that each team received relevant and actionable information, leading to more targeted and effective recruitment strategies.
Research and Insights on Visualization Customization
The importance of customization is supported by data from several studies. A report by the Aberdeen Group indicates that companies that tailor their data presentations to the needs of specific audiences can improve their recruitment efficiency by up to 50%. Furthermore, research by Forrester found that personalized visualizations help stakeholders more quickly understand their impact on business outcomes, leading to faster and more effective decision-making.
The Future of Data in Recruitment: Predictive Analytics
Introduction to Predictive Analytics in Recruitment
Predictive analytics represents the next frontier in recruitment strategy, offering the potential to revolutionize how organizations identify, attract, and retain talent. By analyzing historical data and identifying patterns, predictive analytics can forecast future trends, such as candidate success and retention rates. This proactive approach not only enhances the efficiency of the recruitment process but also improves its effectiveness by enabling better alignment between candidate profiles and job requirements.
Strategic Hiring Presentations
Strategic hiring presentations are essential for aligning recruitment efforts with business goals. These presentations provide insights into long-term workforce planning, ensuring that the right talent is hired to meet current and future needs. Organizations can use them to build strong teams that contribute to sustainable growth and success.
The Evolution and Impact of Predictive Analytics
The use of predictive analytics in recruitment is part of a broader trend towards more data-driven decision-making processes in human resources. Initially used primarily in marketing and sales, predictive analytics has gained traction in recruitment as technology and data collection methods have advanced. Organizations now utilize these analytics to anticipate hiring needs, understand the characteristics of successful employees, and predict candidate success, thereby reducing the likelihood of poor hiring decisions.
Real-World Applications of Predictive Analytics
Examples of predictive analytics in action include a technology firm that developed a model to predict the success of software engineers based on their coding test scores, previous job tenure, and educational background. This model allowed them to focus their recruiting efforts on the best candidates, with the highest probability of long-term success. Another example is a retail company that uses predictive analytics to forecast staffing needs during peak seasons, ensuring they are well-prepared to meet customer demand without overstaffing.
Supporting Research on Predictive Analytics in Recruitment
The benefits of predictive analytics in recruitment are supported by compelling research. According to a study by IBM, organizations that use predictive analytics in recruitment report a 25% decrease in turnover and a 20% increase in performance. Furthermore, Gartner predicts that by 2025, organizations using predictive analytics in talent acquisition will increase their productivity by 15%. These statistics underscore the transformative potential of predictive analytics in shaping the future of recruitment.
Ethical Considerations in Data Use and Presentation
The Importance of Ethics in Data-Driven Recruitment
As recruitment strategies increasingly for companies rely heavily on data, ethical considerations become paramount. Ensuring that data use upholds privacy, consent, and fairness is crucial not only for legal compliance but also for maintaining candidate trust and organizational integrity. Ethical data use involves transparent data collection practices, secure data storage, and equitable data analysis methods that do not perpetuate biases or discrimination.
Key Ethical Principles in Data Handling
Several key principles underpin ethical data use in recruitment. First is transparency, which involves clearly communicating to candidates how their data will be collected, used, and protected. Second is fairness, ensuring that data-driven decisions do not result in discriminatory outcomes. This includes rigorous testing of algorithms for bias and the implementation of corrective measures when biases are detected. Lastly, security is critical, as protecting sensitive candidate information from breaches is essential to ethical data practices.
Case Studies Highlighting Ethical Practices
Examples of ethical data use can be seen in companies that have set standards for ethical data practices. One technology company implemented a rigorous audit process for its recruitment algorithms to ensure they do not inadvertently favor certain demographics over others. Another case involves a multinational corporation that established a candidate data protection policy that exceeds legal requirements, demonstrating their commitment to candidate privacy and securing trust.
Research and Guidelines on Ethical Data Use
The significance of ethical considerations in data use is highlighted by various studies and guidelines. For example, the European Union’s General Data Protection Regulation (GDPR) provides a framework that many companies use as a benchmark for ethical data practices, even outside of Europe. Additionally, research from the Harvard Business Review suggests that companies that adhere to high ethical standards in data use see increased engagement and trust from candidates, which can lead to higher quality hires and improved employer branding.
Ready to build a more data-driven recruitment strategy? Let’s discuss how INK PPT can support your hiring goals with tailored data visualization solutions. Get in touch and start making informed, strategic hiring decisions today!
Frequently Asked Questions (FAQs)
How do you present a recruitment strategy?
To present a recruitment strategy effectively, focus on aligning the strategy with the organization's overall goals, outline the key performance indicators, and detail the methods and channels to be used for sourcing candidates. Utilize clear, engaging visual aids such as templates such as PowerPoint slides, dashboards, and charts to illustrate plans and expected outcomes. Ensure that the presentation addresses specific needs and concerns of stakeholders to facilitate buy-in.
What is sourcing strategy in recruitment?
A sourcing strategy in recruitment defines how an organization plans to identify and engage potential candidates for open positions. It involves selecting the appropriate channels and tools—such as job boards, social media platforms, employee referral programs, and professional networking events—to reach a diverse pool of qualified candidates. The recruitment sourcing strategy presentation and should be tailored to the specific requirements of each role and the company’s broader talent acquisition goals.
What should be included in a sourcing strategy?
A sourcing strategy should include a clear definition of target candidate profiles, preferred sourcing channels, and methods for engaging candidates. It should also outline budget considerations, expected timelines, and key performance metrics for assessing the effectiveness of different sourcing channels. Additionally, the strategy should consider compliance with employment laws and ethical standards in candidate search and engagement.
What are 5 recruitment strategies?
Five effective recruitment strategies include:
Online Job Postings: Utilizing popular online job posting on boards and career websites to reach a large audience.
Social Media Recruiting: Engaging potential candidates and recruit them on platforms like LinkedIn, Facebook, and Twitter.
Employee Referral Programs: Leveraging existing employees' networks to find qualified candidates who are more likely to be a good fit for the company culture.
Recruitment Events: Participating in job fairs, campus recruitments, and industry conferences to interact directly with potential candidates.
Talent Pool Databases: Building and maintaining a database of past applicants and potential candidates for future position openings.
How do you do a presentation for recruitment?
A recruitment presentation should be structured to clearly communicate the objectives, processes, and benefits of the proposed recruitment strategy. Start with an overview of the current market conditions and the need for new talent. Follow with detailed plans on how candidates will be sourced, screened, and selected. Use data and visuals to support your strategies and conclude with expected outcomes and benefits for the organization.
What are the techniques of strategic sourcing?
Strategic sourcing techniques include:
Market Analysis: Understanding the availability of talent and benchmarking against industry standards.
Segmentation of Talent Pools: Identifying different groups of candidates based on skills, experience, and potential for growth.
Relationship Building: Engaging with potential candidates through continuous communication and networking.
Technology Utilization: Employing applicant tracking systems (ATS) and recruitment marketing tools to make applicant tracking system streamline the sourcing process.
Performance Metrics: Regularly measuring the effectiveness of sourcing strategies and making necessary adjustments.
What is a talent acquisition sourcing strategy?
A talent acquisition or talent sourcing strategy is a comprehensive plan that outlines how an organization intends to find, attract, and hire top talent. This strategy should address both immediate hiring needs and longer-term talent pipeline requirements. It focuses on using a mix of traditional and innovative sourcing techniques to reach a diverse group of potential candidates and convert them into applicants.
What are the techniques of strategic sourcing?
Strategic sourcing in recruitment often involves a detailed analysis of the labor market, competitor analysis, and building a robust employer brand to attract top talent. Techniques include proactive sourcing of passive candidates through online professional networks, building relationships with potential candidates via recruitment events, and leveraging data analytics to fine-tune sourcing approaches based on effectiveness.


%20(1).jpg)
%20(1).jpg)
